
Trading statistics
In the cabinet: header → Assets → Statistics
Link: futures · spot
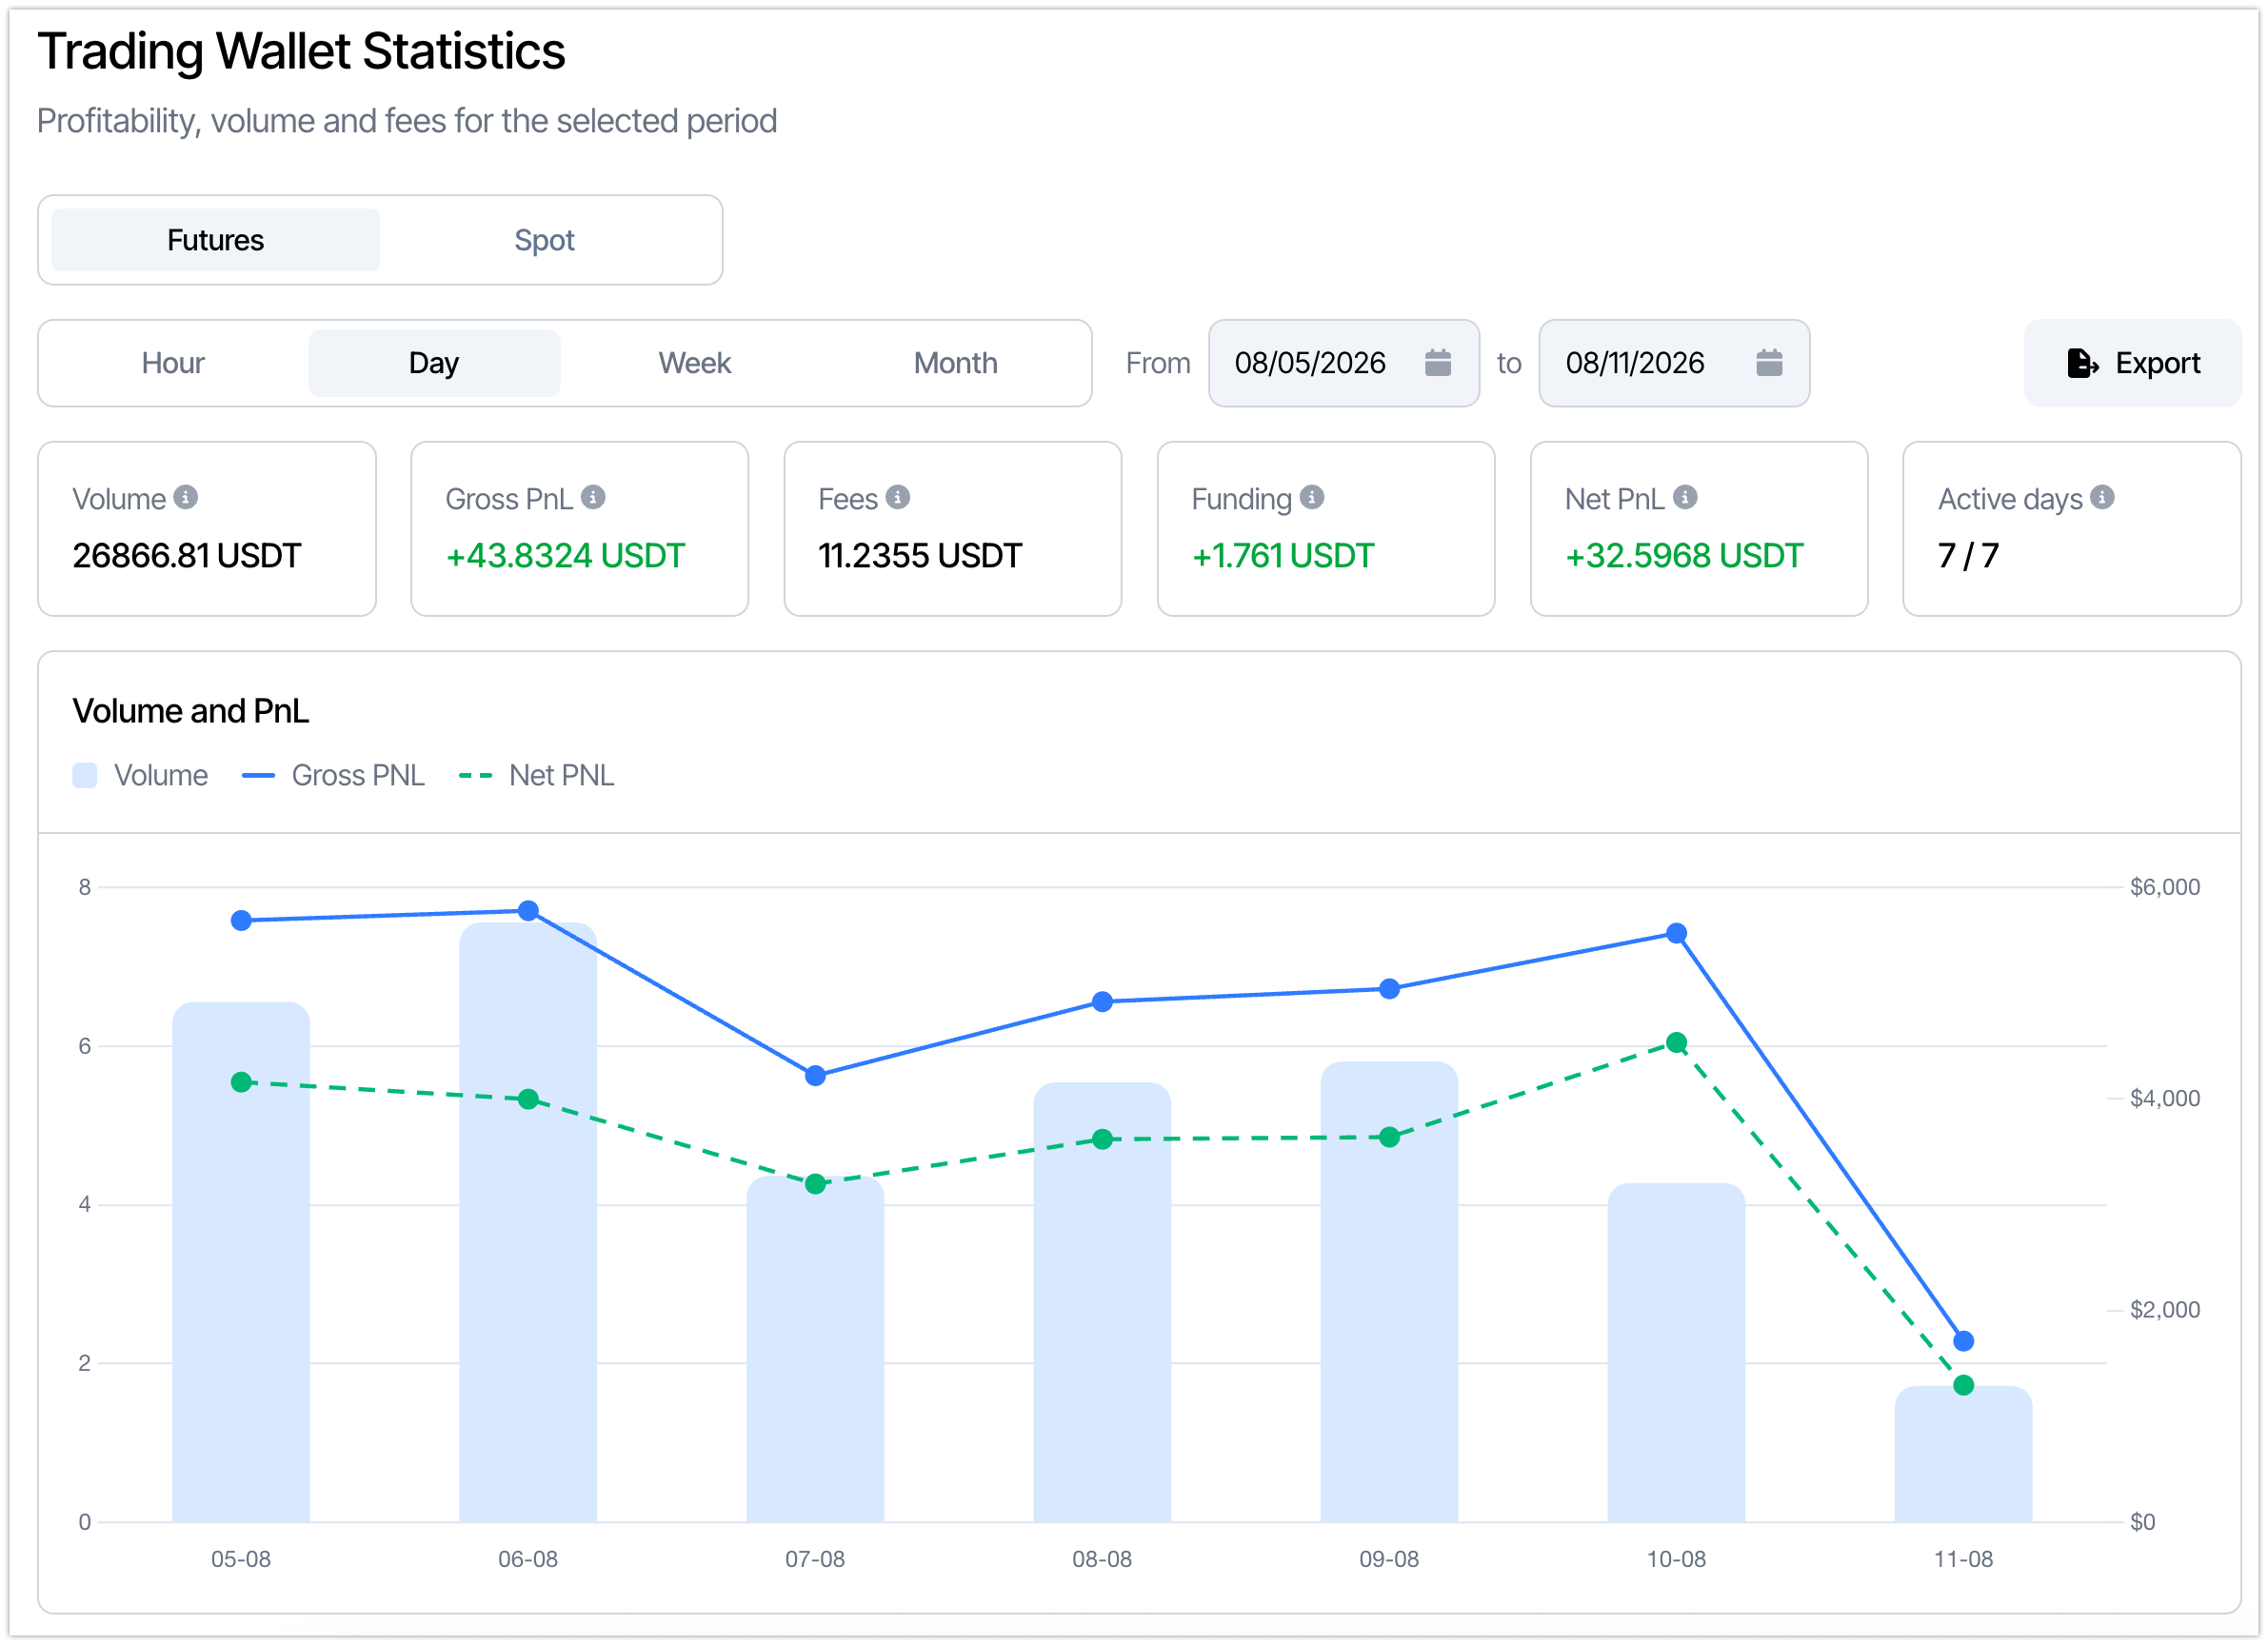
The Trading statistics section gives full analytics for the trading wallet of the selected exchange account (Bybit or Binance liquidity): profitability, volume and fees for the selected period. The toolset is broad — you can build detailed statistical slices right inside Cryptorg, without resorting to third-party services.
Statistics are available for both spot and futures — switch the market with the tabs at the top of the section.
Filters and period
Section titled “Filters and period”- Futures / Spot — market selector.
- Granularity — Hour, Day, Week, Month.
- Period — an arbitrary “from … to” date range.
- Export — export the statistics for the selected period.
Futures
Section titled “Futures”Futures come with full PnL analytics.
Summary metrics
Section titled “Summary metrics”Cards above the chart:
- Volume — total turnover for the period.
- Gross PnL — gross profit/loss before fees.
- Fees — total trading fees.
- Funding — total funding paid and received.
- Net PnL — net result (Gross PnL − fees ± funding).
- Active days — how many days of the period had trading.
The Volume and PnL chart combines volume bars with the Gross PnL and Net PnL lines.
Net PnL Calendar
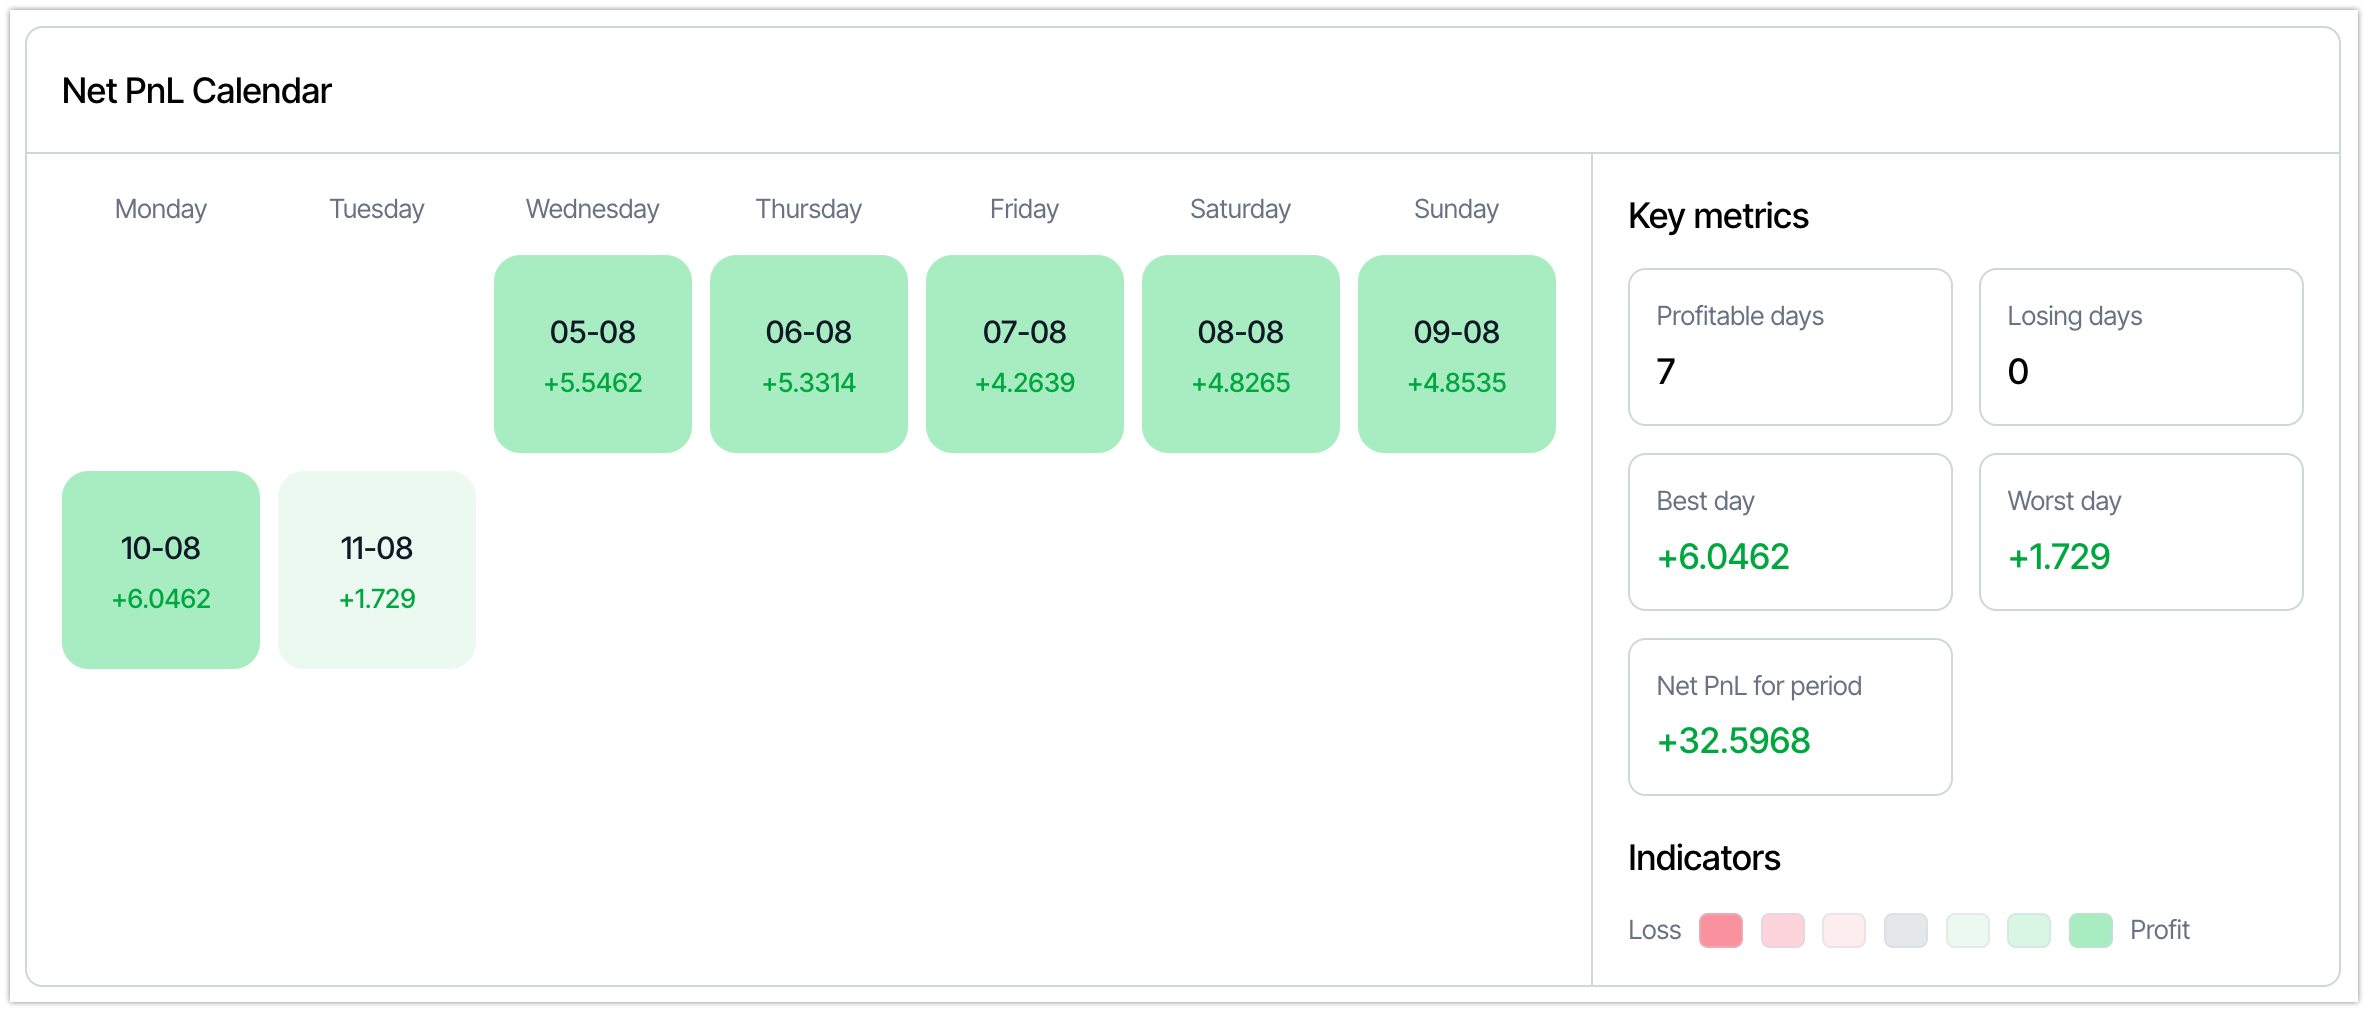
Section titled “Net PnL Calendar”A weekday calendar with colour fill (from loss to profit) and a Key metrics panel: profitable and losing days, best and worst day, Net PnL for the period.
Top trading pairs
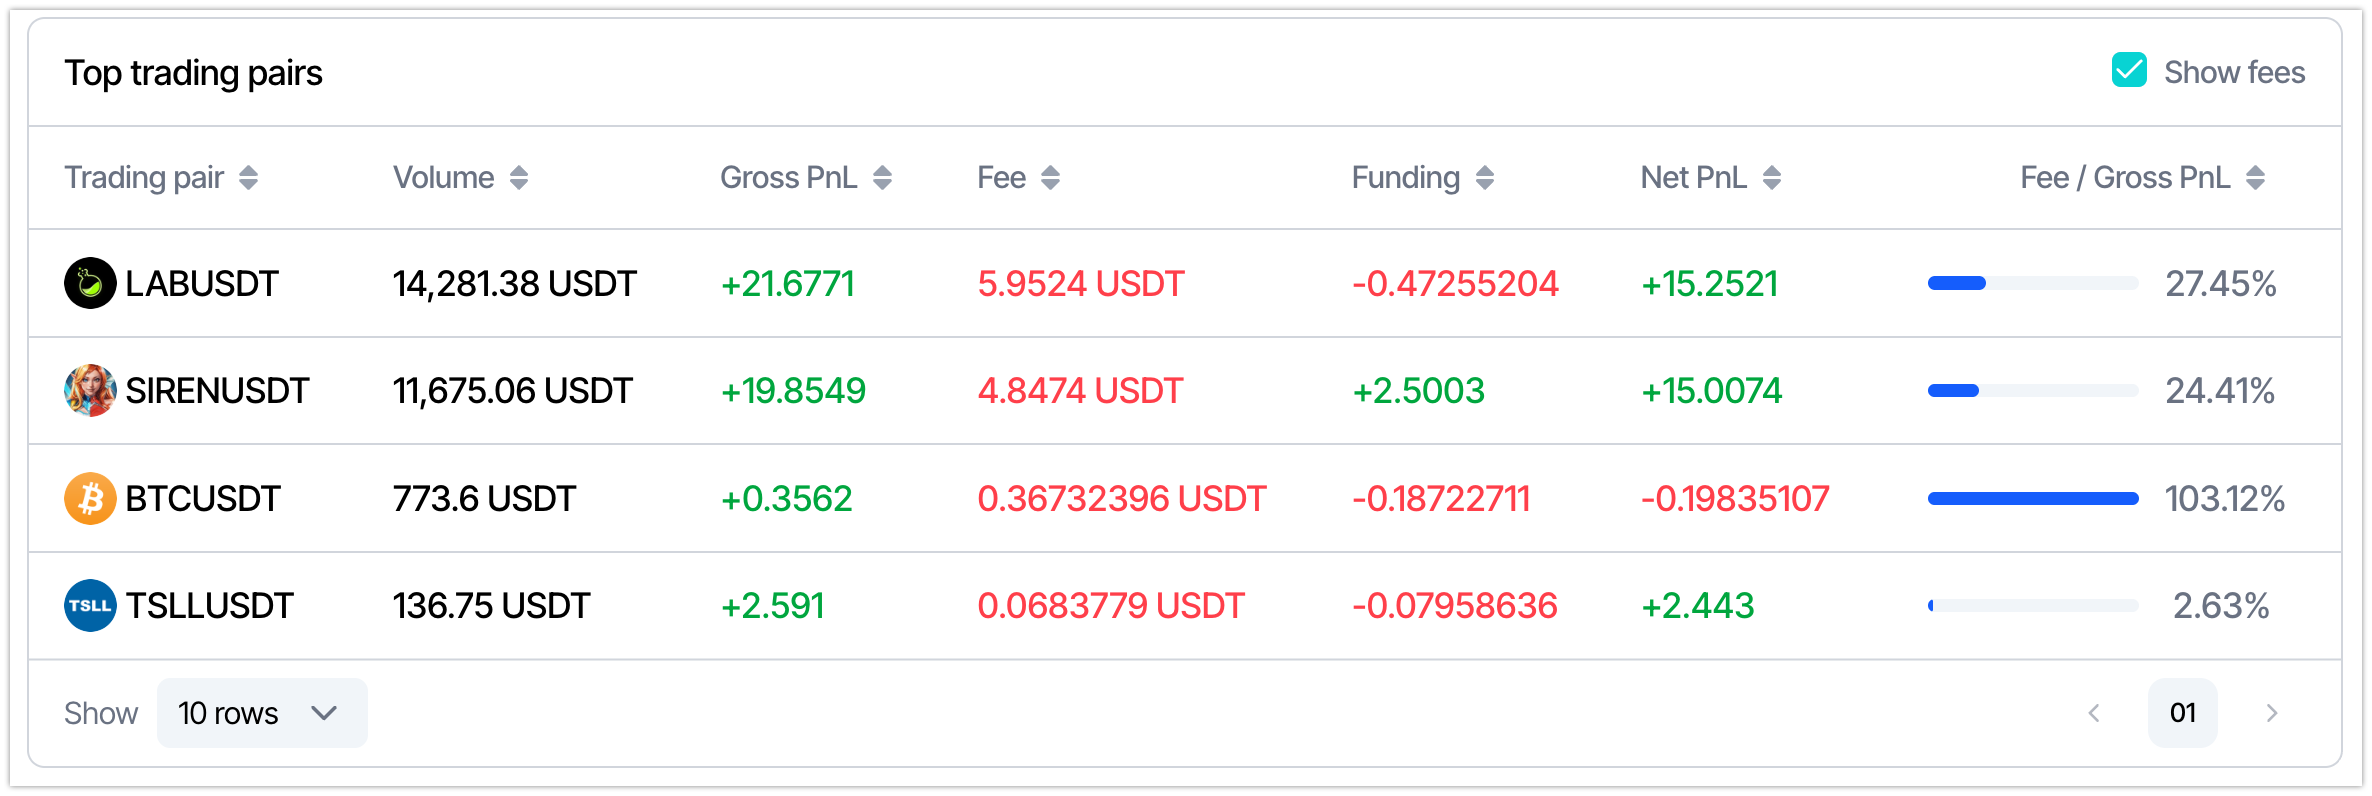
Section titled “Top trading pairs”A per-pair table: volume, Gross PnL, fee, funding, Net PnL and the Fee / Gross PnL ratio. Includes a “Show fees” checkbox and sorting by any column.
Period breakdown
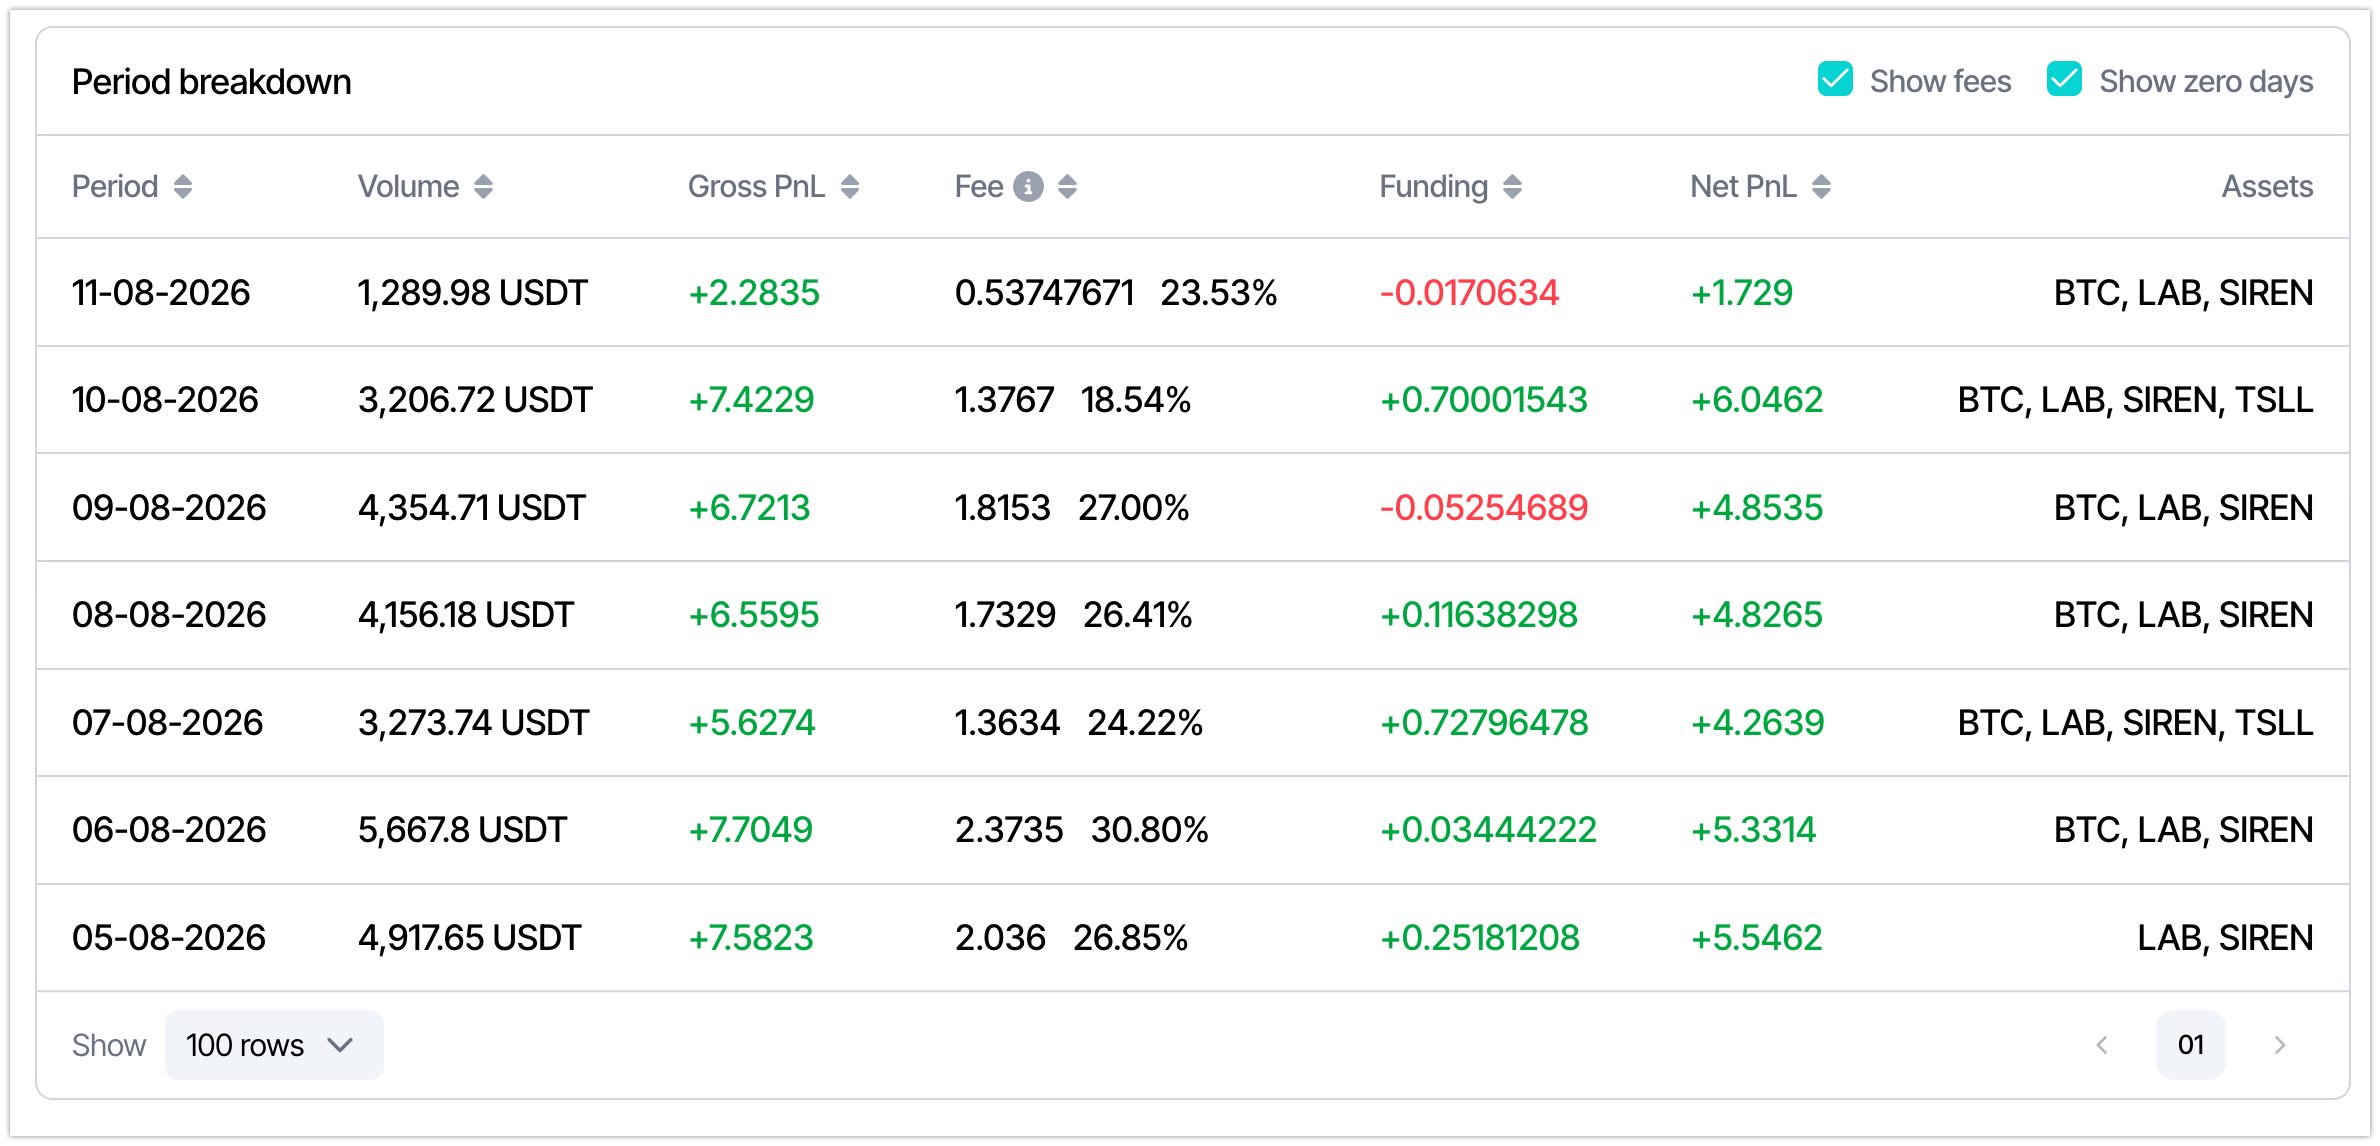
Section titled “Period breakdown”A row-by-row breakdown: volume, Gross PnL, fee (in USDT and as % of volume), funding, Net PnL and the list of assets traded. “Show fees” and “Show zero days” checkboxes.
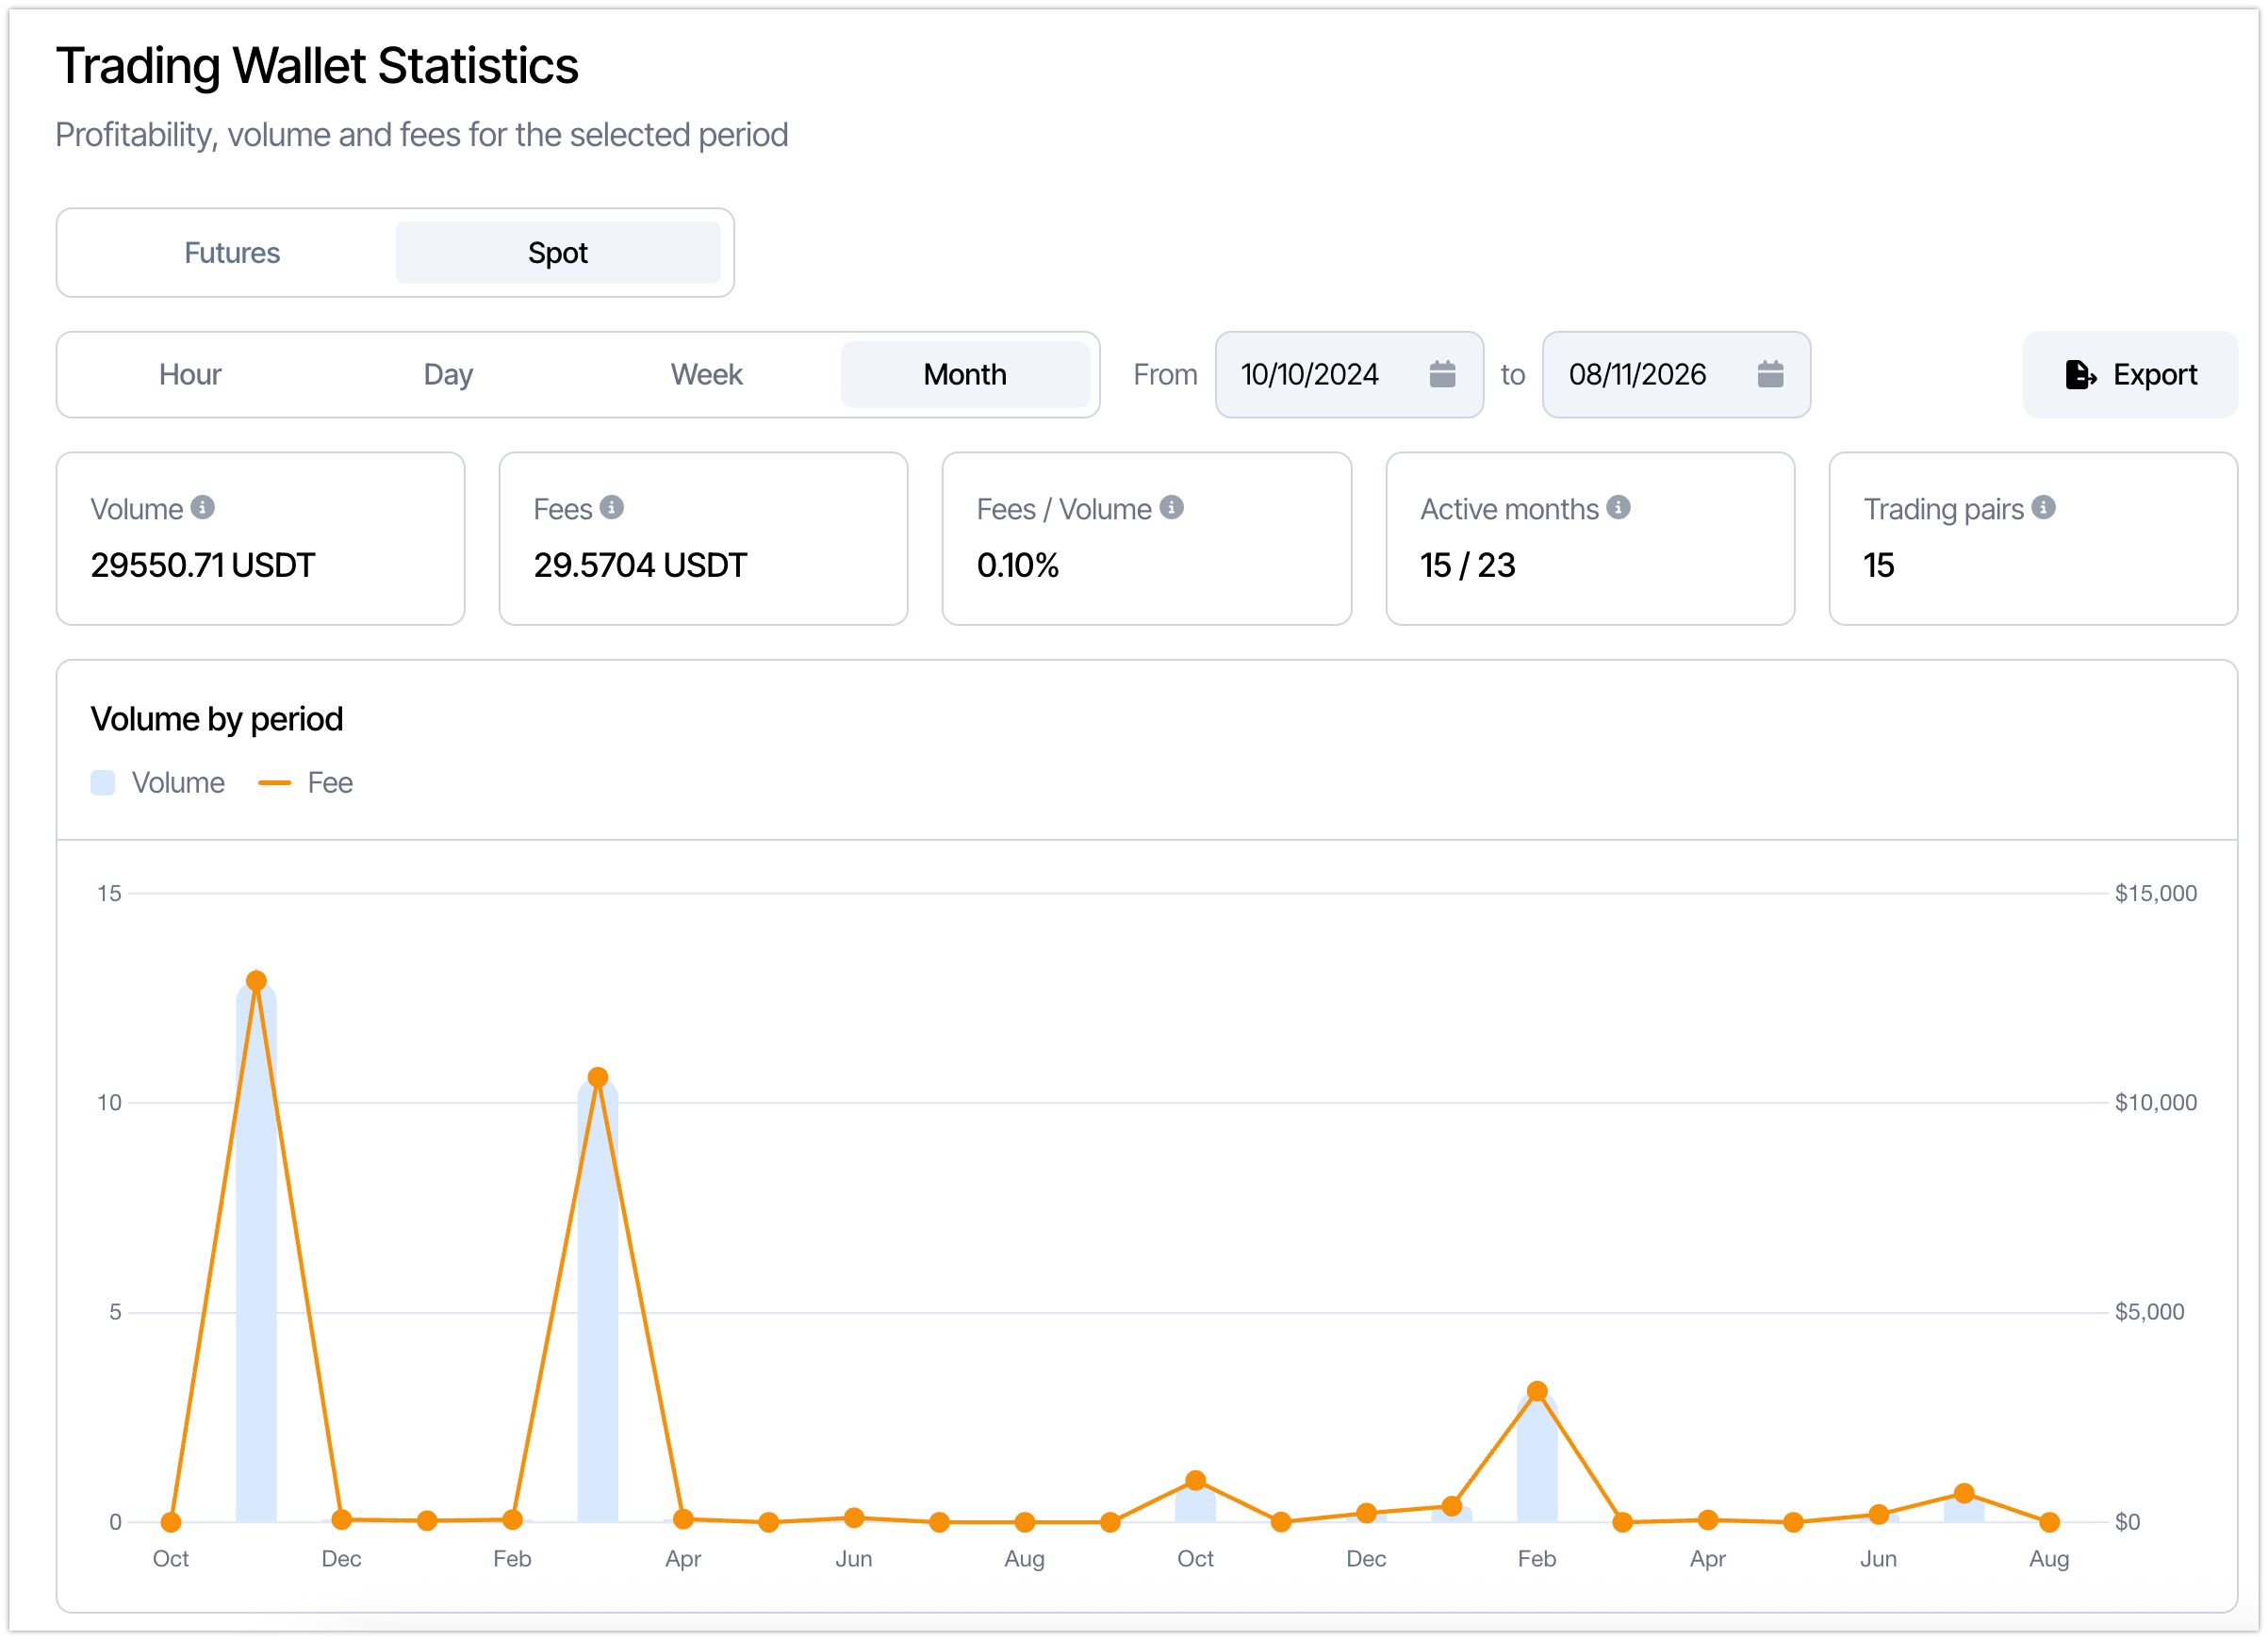
For spot the statistics focus on volume and fees (no PnL or funding).
Summary metrics
Section titled “Summary metrics”- Volume — turnover for the period.
- Fees — total fees.
- Fees / Volume — the share of fees in turnover.
- Active months (or days/weeks — depending on the chosen granularity).
- Trading pairs — how many pairs were traded.
The Volume by period chart shows volume bars and a fee line.
Trading pairs
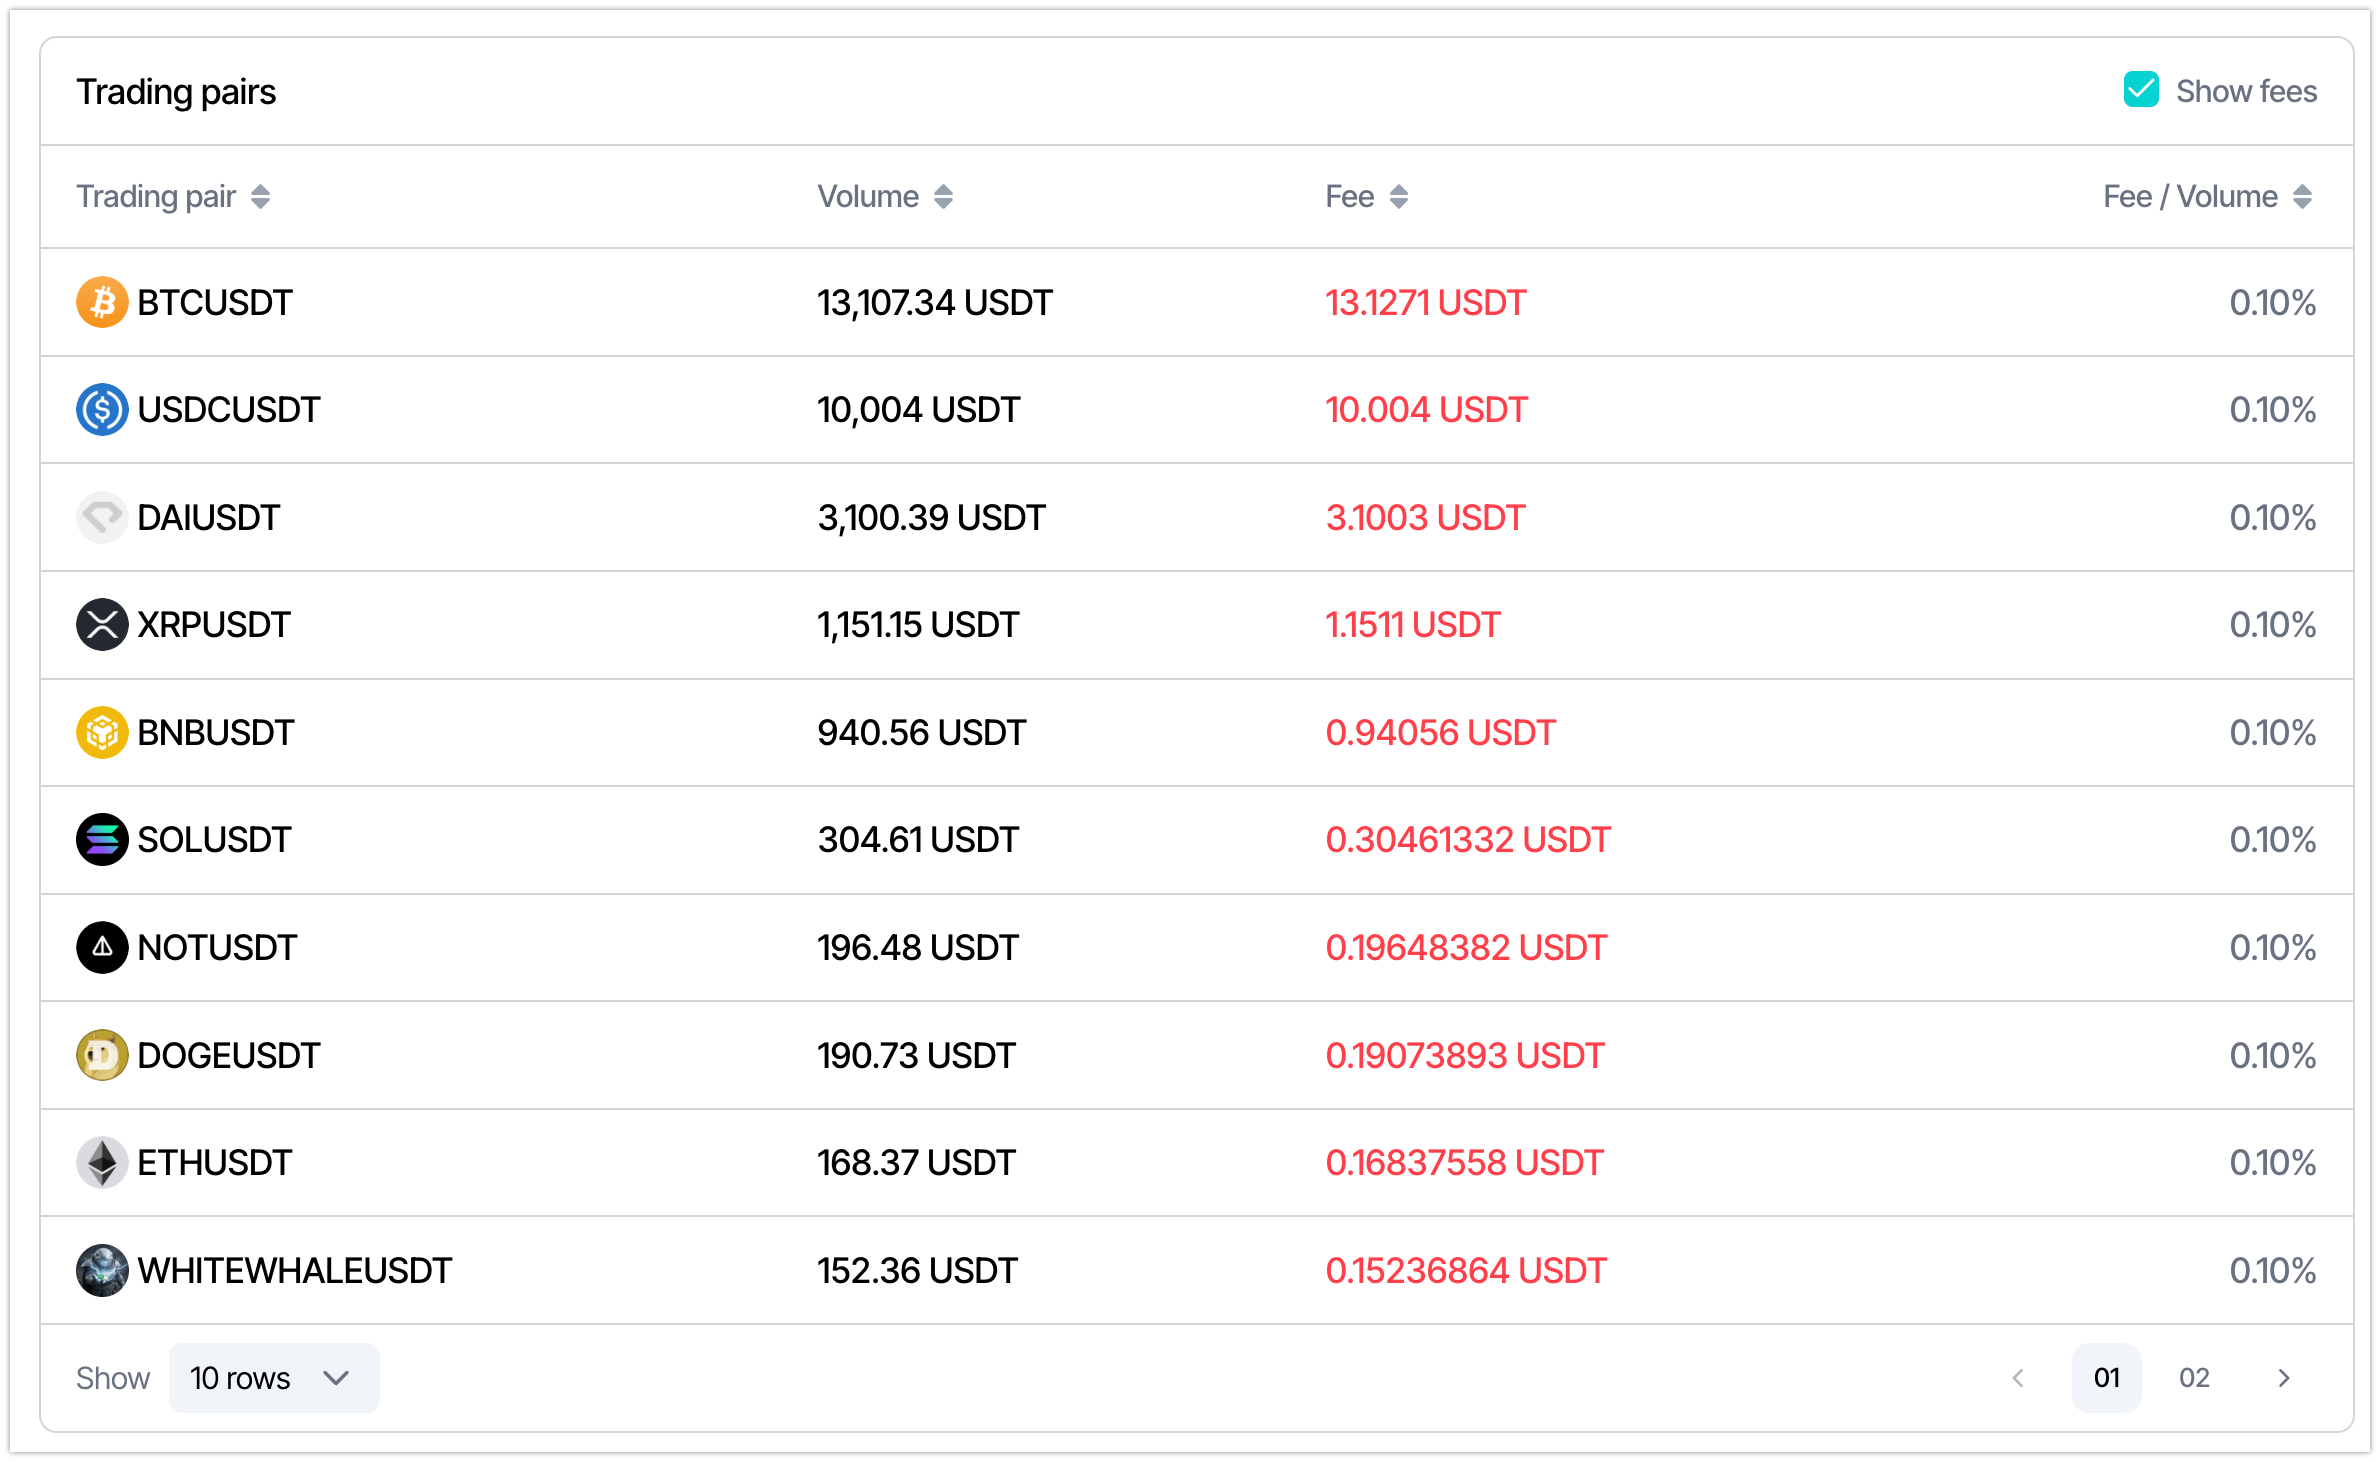
Section titled “Trading pairs”A per-pair table: volume, fee and the Fee / Volume ratio.
Period breakdown
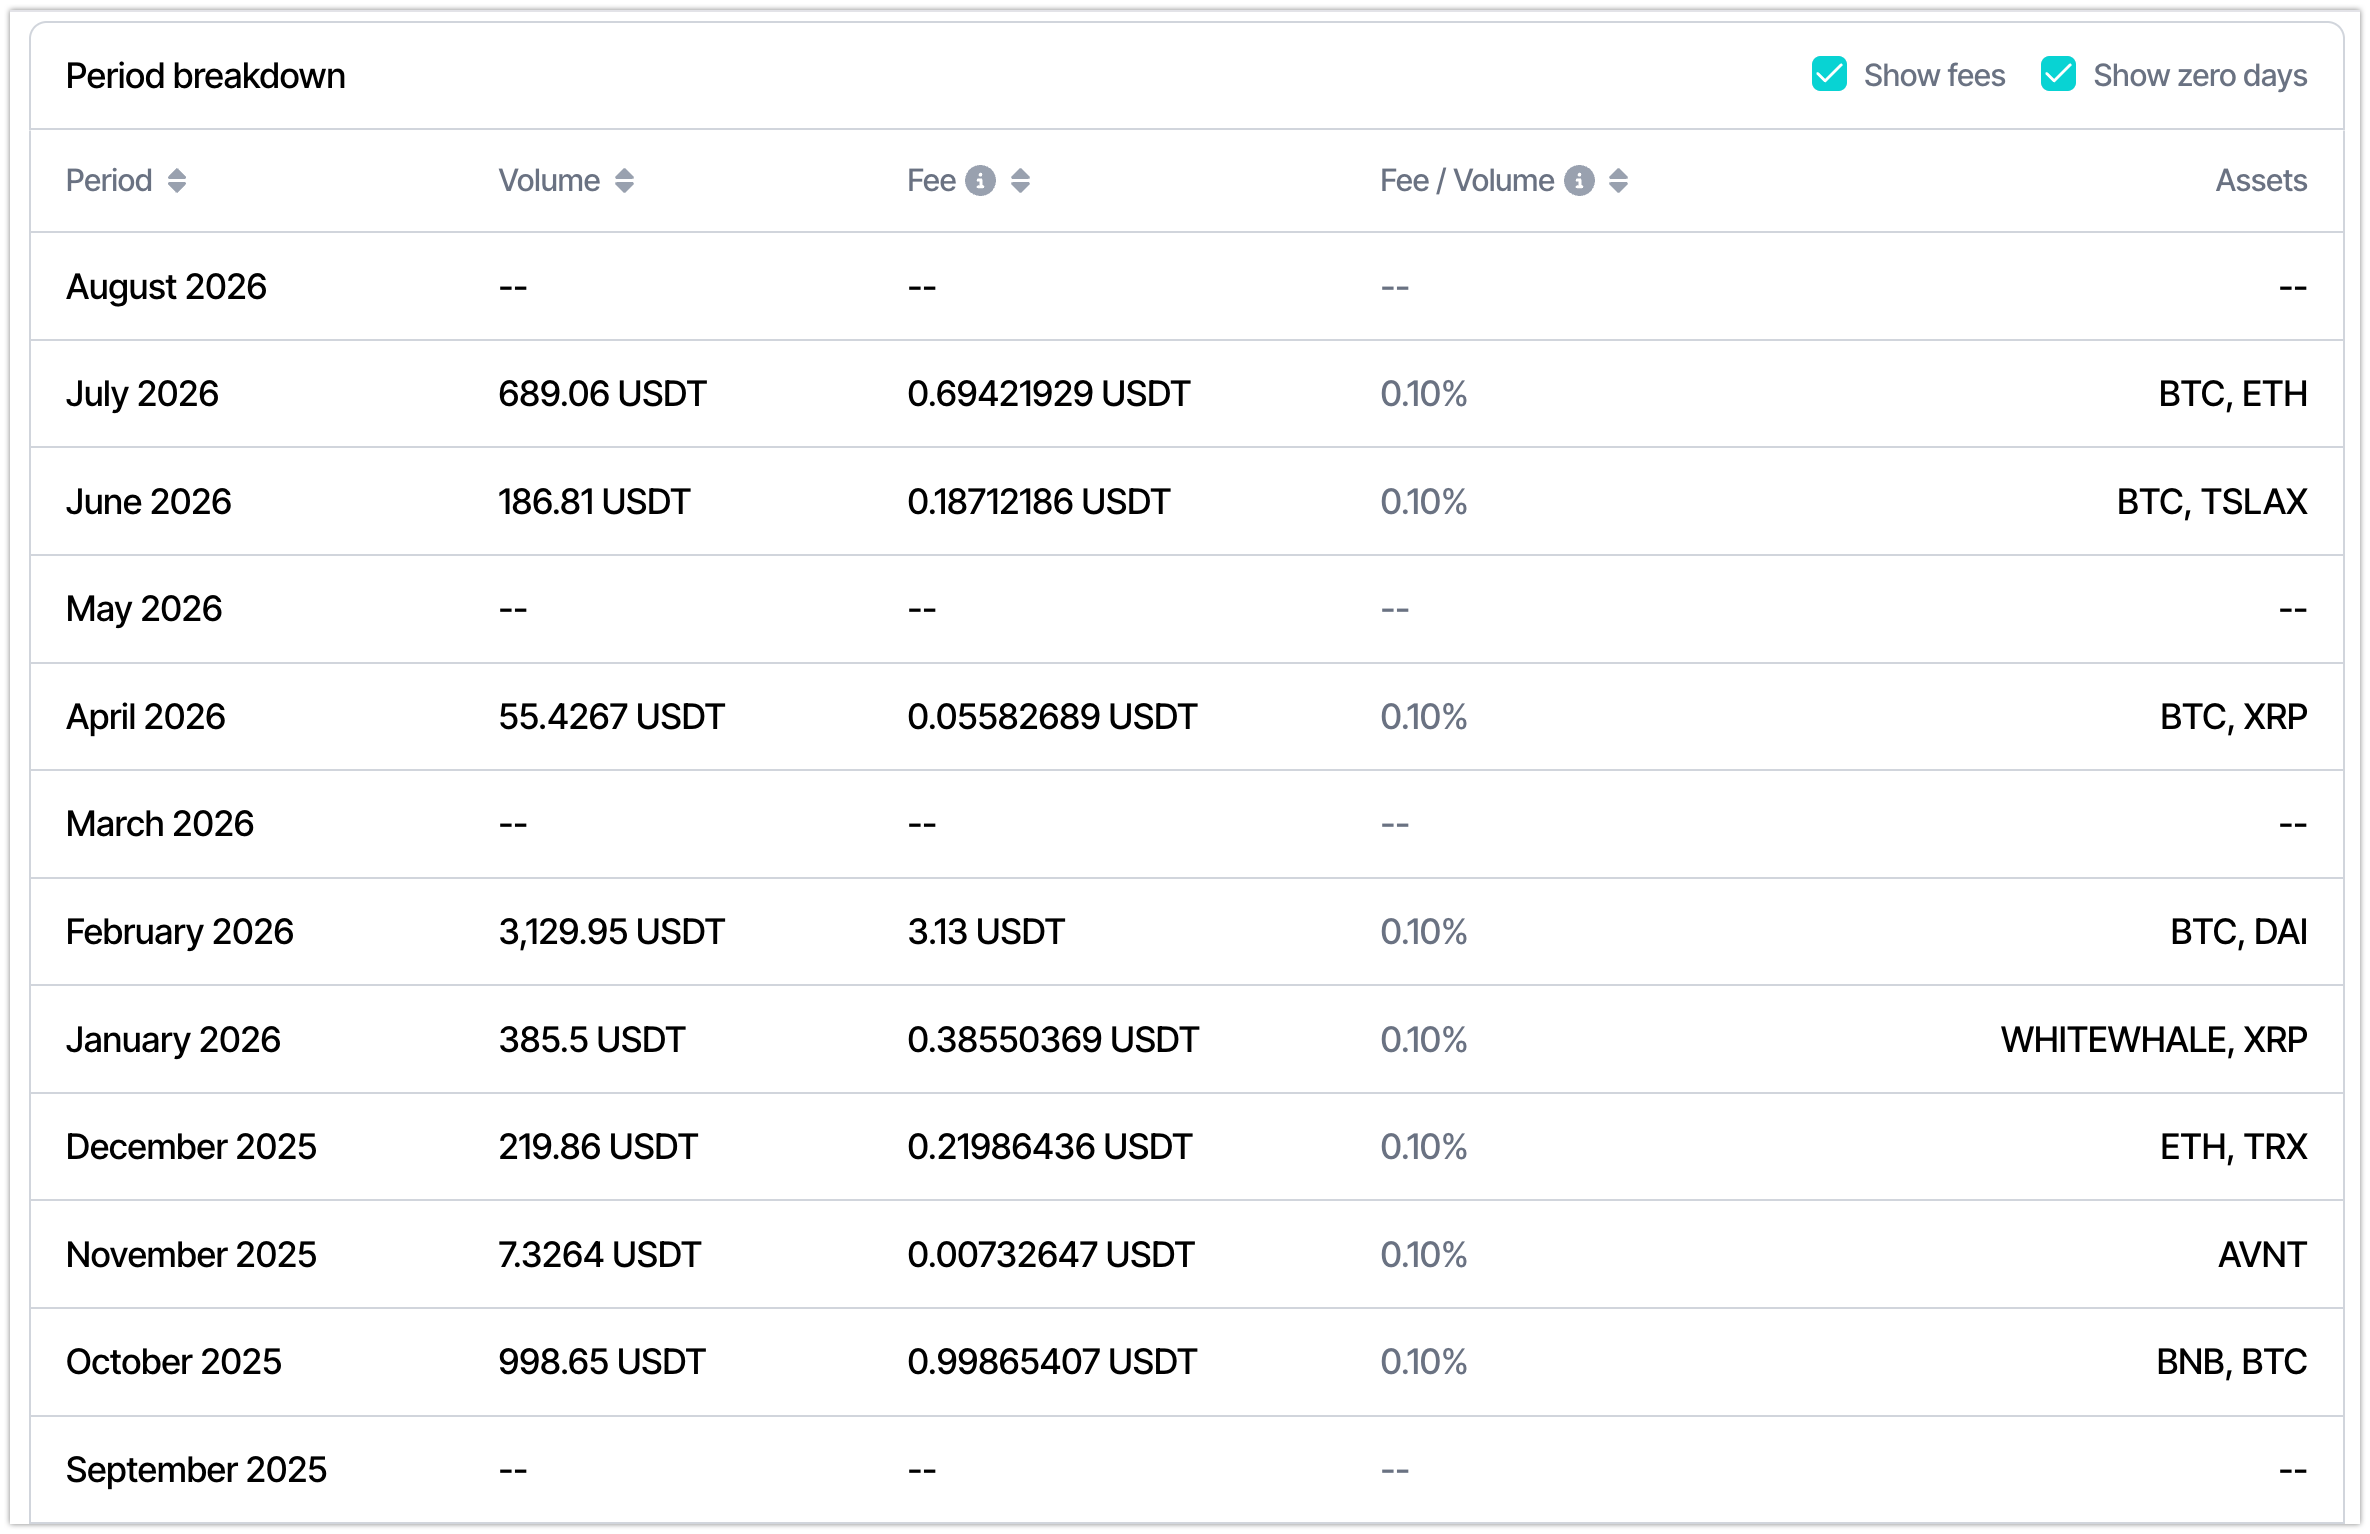
Section titled “Period breakdown”A per-period breakdown: volume, fee, Fee / Volume and the assets traded. The “Show zero days” checkbox also shows periods with no trades.
Export
Section titled “Export”The Export button downloads the statistics for the selected period — handy for reporting and external analysis.